2024-07-31 ノースカロライナ州立大学(NCState)
<関連情報>
- https://news.ncsu.edu/2024/07/new-model-uses-satellite-imagery-machine-learning-to-map-flooding-in-urban-environments/
- https://link.springer.com/article/10.1007/s11069-024-06817-5
衛星画像と機械学習を用いた都市部の洪水範囲の定量化 Quantifying urban flood extent using satellite imagery and machine learning
Rebecca W. Composto,Mirela G. Tulbure,Varun Tiwari,Mollie D. Gaines & Júlio Caineta
Natural Hazards Published:27 July 2024
DOI:https://doi.org/10.1007/s11069-024-06817-5
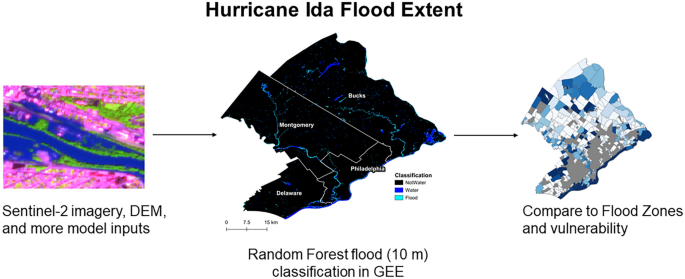
Graphical abstract

Abstract
The risk of floods from tropical storms is increasing due to climate change and human development. Maps of past flood extents can aid in planning and mitigation efforts to decrease flood risk. In 2021, Hurricane Ida slowed over the Mid-Atlantic and Northeast United States and released unprecedented rainfall. Satellite imagery and the Random Forest algorithm are a reliable combination to map flood extents. However, this combination is not usually applied to urban areas. We used Sentinel-2 imagery (10 m), along with derived indices, elevation, and land cover data, as inputs to a Random Forest model to make a new flood extent for southeastern Pennsylvania. The model was trained and validated with a dataset created with input from PlanetScope imagery (3 m) and social media posts related to the flood event. The overall accuracy of the model is 99%, and the flood class had a user’s and producer’s accuracy each over 97%. We then compared the flood extent to the Federal Emergency Management Agency flood zones at the county and tract level and found that more flooding occurred in the Minimal Hazard zone than in the 500-year flood zone. Our Random Forest model relies on publicly available data and software to efficiently and accurately make a flood extent map that can be deployed to other urban areas. Flood extent maps like the one developed here can help decision-makers focus efforts on recovery and resilience.


